Metrics
Pecos includes several metrics that describe the quality control analysis or compute quantities that might be of use in the analysis. Many of these metrics aggregates over time and can be saved to track long term performance and system health.
While Pecos typically runs a series of quality control tests on raw data, quality control tests can also be run on metrics generated from these analyses to track long term performance and system health. For example, daily quality control analysis can generate summary metrics that can later be used to generate a yearly summary report. Pecos includes a performance metrics example (based on one year of PV metrics) in the examples/metrics directory.
Quality control index
The quality control index (QCI) is a general metric which indicates the
percent of data points that pass quality control tests.
Duplicate and non-monotonic indexes are not counted as failed tests
(duplicates are removed and non-monotonic indexes are reordered).
A value of 1 indicates that all data passed all tests.
QCI is computed for each column of data.
For example, if the data contains 720 entries and
700 pass all quality control tests, then the QCI is 700/720 = 0.972.
QCI is computed using the qci method.
To compute QCI,
>>> QCI = pecos.metrics.qci(pm.mask)
Root mean square error
The root mean squared error (RMSE) is used to compare the
difference between two variables.
RMSE is computed for each column of data (note, the column names in the two data sets must be equal).
This metric is often used to compare measured to modeled data.
RMSE is computed using the rmse method.
Time integral
The integral is computed using the trapezoidal rule and is computed using
the time_integral method.
The integral is computed for each column of data.
Time derivative
The derivative is computed using central differences and is computed using
the time_derivative method.
The derivative is computed for each column of data.
Probability of detection and false alarm rate
The probability of detection (PD) and false alarm rate (FAR) are used to evaluate how well a quality control test (or set of quality control tests) distinguishes background from anomalous conditions. PD and FAR are related to the number of true negatives, false negatives, false positives, and true positives, as shown in Figure 3. The estimated condition can be computed using results from quality control tests in Pecos, the actual condition must be supplied by the user. If actual conditions are not known, anomalous conditions can be superimposed in the raw data to generate a testing data set. A “good” quality control test (or tests) result in a PD close to 1 and FAR close to 0.
Receiver Operating Characteristic (ROC) curves are used to compare the
effectiveness of different quality control tests, as shown in Figure 4.
To generate a ROC curve, quality control test input parameters (i.e. upper
bound for a range test) are systematically adjusted.
PD and FAR are computed using the probability_of_detection
and false_alarm_rate methods.
These metrics are computed for each column of data.
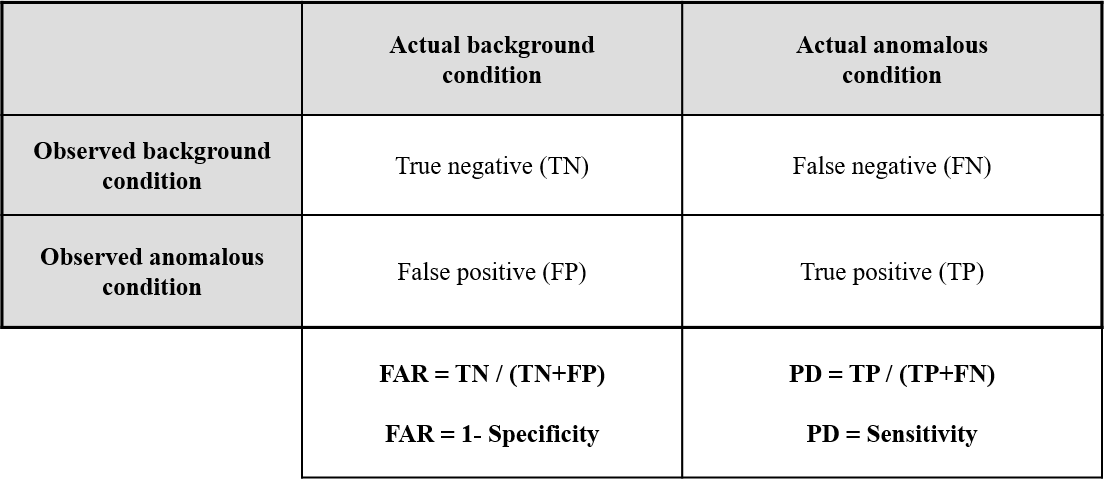
Figure 3 Relationship between FAR and PD.
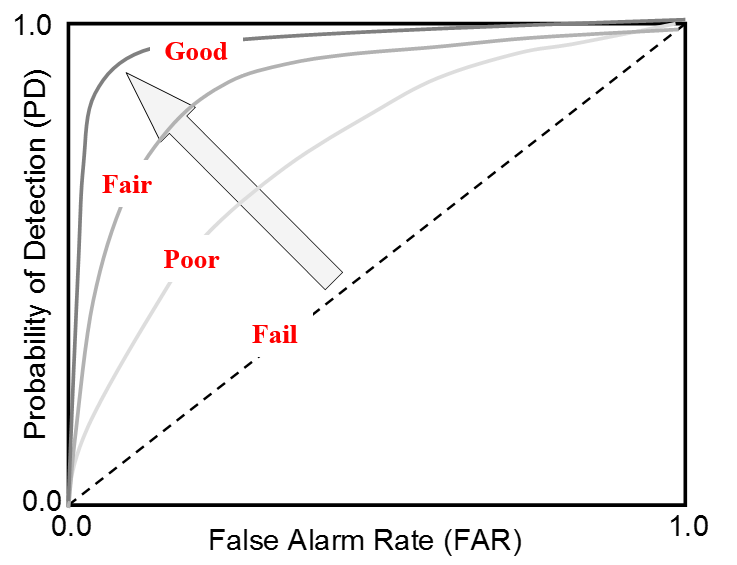
Figure 4 Example ROC curve.