Results
Analysis run using Pecos results in a collection of quality control test results, quality control mask, cleaned data, and performance metrics. This information can be used to generate HTML/LaTeX reports and dashboards.
Quality control test results
When a quality control test fails, information is stored in:
pm.test_results
This DataFrame is updated each time a new quality control test is run. Test results includes the following information:
Variable Name: Column name in the DataFrame
Start Time: Start time of the failure
End Time: : End time of the failure
Timesteps: The number of consecutive time steps involved in the failure
Error Flag: Error messages include:
Duplicate timestamp
Nonmonotonic timestamp
Missing data (used for missing data and missing timestamp)
Corrupt data
Data < lower bound OR Data > upper bound
Increment < lower bound OR Increment > upper bound
Delta < lower bound OR Delta > upper bound
Outlier < lower bound OR Outlier > upper bound
A subset of quality control test results from the Simple example are shown below.
>>> print(pm.test_results)
  Variable Name      Start Time        End Time  Timesteps                   Error Flag
1           NaN   1/1/2015 5:00   1/1/2015 5:00          1            Missing timestamp
2           NaN  1/1/2015 17:00  1/1/2015 17:00          1          Duplicate timestamp
3           NaN  1/1/2015 19:30  1/1/2015 19:30          1       Nonmonotonic timestamp
4             A  1/1/2015 12:00  1/1/2015 14:30         11  Delta < lower bound, 0.0001
5             B   1/1/2015 6:30   1/1/2015 6:30          1        Data < lower bound, 0
6             B  1/1/2015 15:30  1/1/2015 15:30          1        Data > upper bound, 1
7             C   1/1/2015 7:30   1/1/2015 9:30          9                 Corrupt data
Note that variable names are not recorded for timestamp test failures (Test results 1, 2, and 3).
The write_test_results method is used to write quality control test results to a CSV file.
This method can be customized to write quality control test results to a database or to other file formats.
Quality control mask
Boolean mask indicating data that failed a quality control test is stored in:
pm.mask
This DataFrame is updated each time a new quality control test is run. True indicates that data pass all tests, False indicates data did not pass at least one test (or data is NaN).
Cleaned data
Cleaned data set is stored in:
pm.cleaned_data
This DataFrame is updated each time a new quality control test is run. Data that failed a quality control test are replaced by NaN.
Note that Pandas includes several methods to replace NaN using different replacement strategies. Generally, the best data replacement strategy must be defined on a case by case basis. Possible strategies include:
Replacing missing data using linear interpolation or other polynomial approximations
Replacing missing data using a rolling mean of the data
Replacing missing data with a data from a previous period (previous day, hour, etc.)
Replacing missing data with data from a redundant sensor
Replacing missing data with values from a model
These strategies can be accomplished using the Pandas methods interpolate, replace, and fillna.
See Pandas documentation for more details.
Metrics
The write_metrics method is used to write metrics that describe the quality control analysis (i.e. QCI) to a CSV file.
This method can be customized to write performance metrics to a database or to other file formats.
The method can be called multiple times to appended metrics based on the timestamp of the DataFrame.
>>> print(metrics_day1)
              QCI   RMSE
2018-01-01  0.871  0.952
>>> print(metrics_day2)
              QCI   RMSE
2018-01-02  0.755  0.845
>>> pecos.io.write_metrics(metrics_day1, 'metrics_file.csv')
>>> pecos.io.write_metrics(metrics_day2, 'metrics_file.csv')
The metrics_file.csv file will contain:
              QCI   RMSE
2018-01-01  0.871  0.952
2018-01-02  0.755  0.845
Monitoring reports
The write_monitoring_report method is used to generate a HTML or LaTeX formatted monitoring report.
The monitoring report includes the start and end time for the data that was analyzed, custom graphics
and performance metrics, a table that includes test results, graphics associated
with the test results (highlighting data points that failed a quality control tests),
notes on runtime errors and warnings, and the configuration options
used in the analysis.
Custom Graphics: Custom graphics are created by the user for their specific application. Custom graphics can also be generated using methods in the
graphicsmodule. These graphics are included at the top of the report.Performance Metrics: Performance metrics are displayed in a table.
Test Results Test results contain information stored in pm.test_results. Graphics follow that display the data point(s) that caused the failure. Test results graphics are generated using the
plot_test_resultsmethod.Notes: Notes include Pecos runtime errors and warnings. Notes include:
Empty/missing data
Formatting error in the translation dictionary
Insufficient data for a specific quality control test
Insufficient data or error when evaluating string
Configuration Options: Configuration options used in the analysis.
Figure 5 shows the monitoring report from the Simple example.
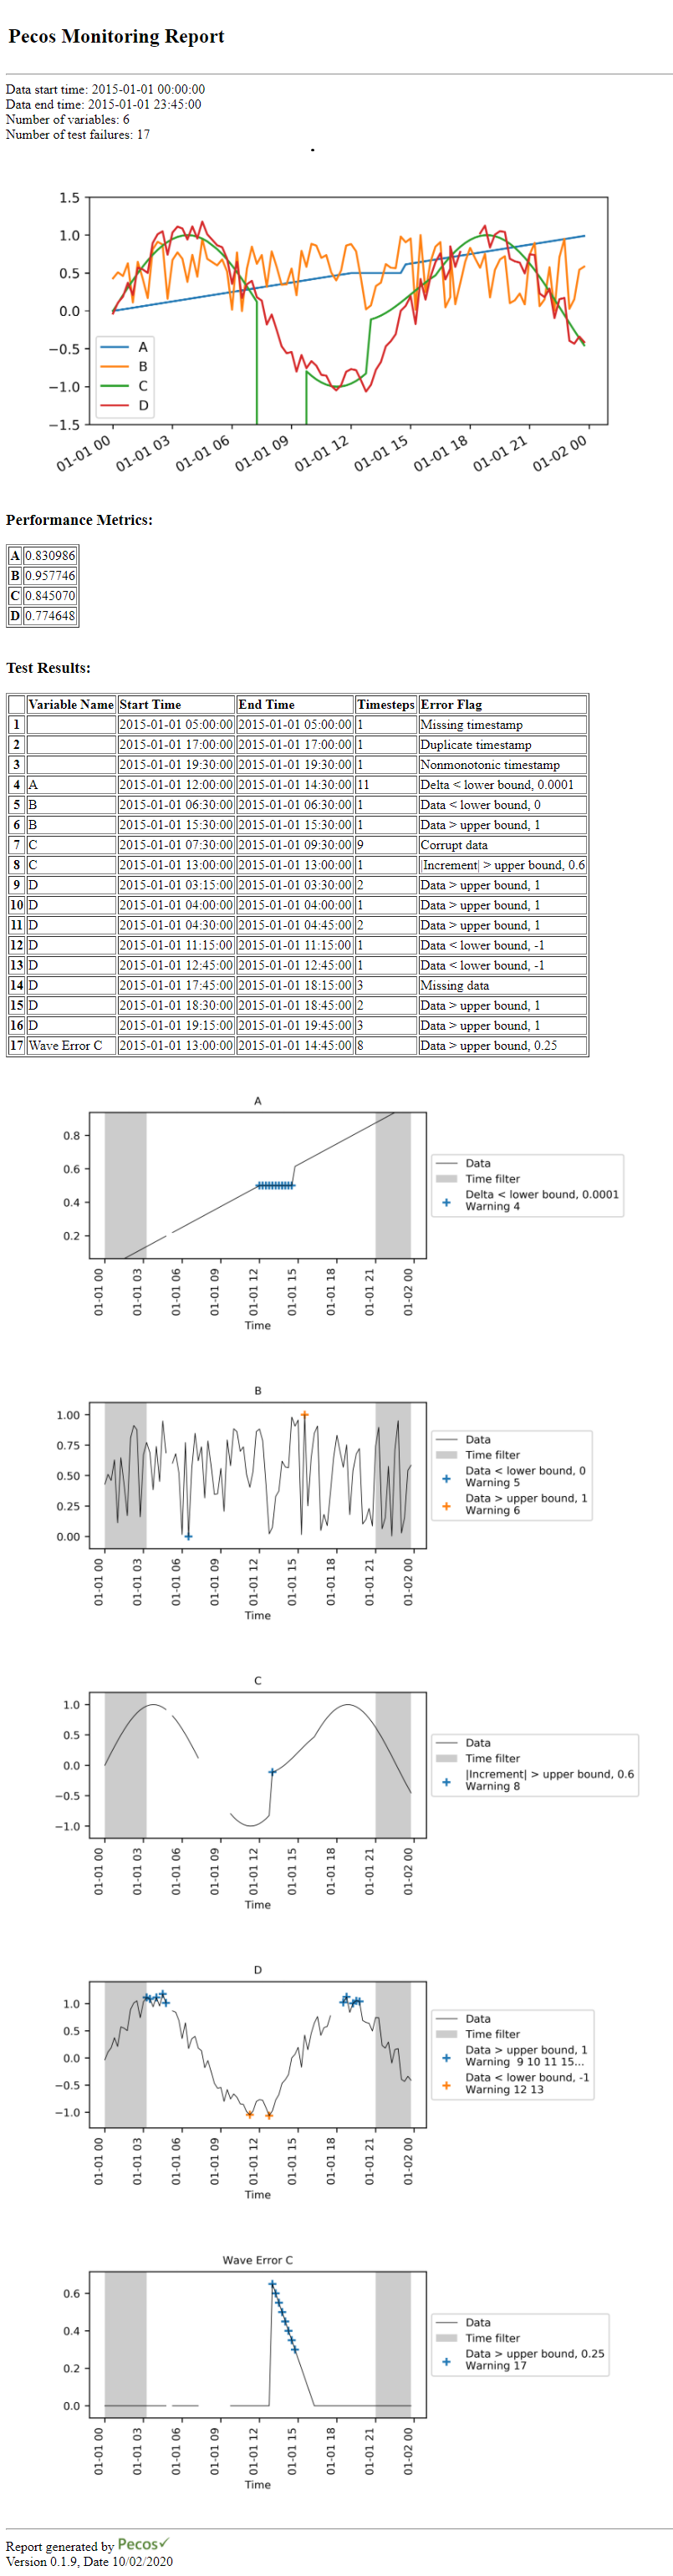
Figure 5 Example monitoring report.
Dashboards
To compare quality control analysis across several systems, key graphics and metrics
can be gathered in a dashboard view.
For example, the dashboard can contain multiple rows (one for each system) and multiple columns (one for each location).
The dashboard can be linked to monitoring reports and interactive graphics for more detailed information.
The write_monitoring_report method is used to generate a HTML dashboard.
For each row and column in the dashboard, the following information can be specified
Text (i.e. general information about the system/location)
Graphics (i.e. a list of custom graphics)
Table (i.e. a Pandas DataFrame with performance metrics)
Links (i.e. the path to a monitoring report or other file/site for additional information)
The user defined text, graphics, tables, and links create custom dashboards. Pecos includes dashboard examples in the examples/dashboard directory. Figure 6, Figure 7, and Figure 8 show example dashboards generated using Pecos.
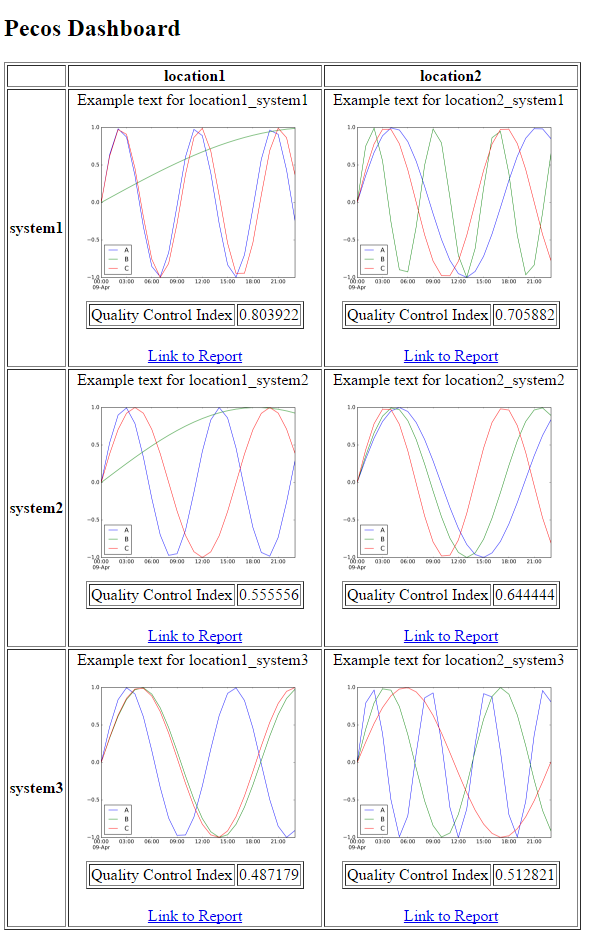
Figure 6 Example dashboard 1.
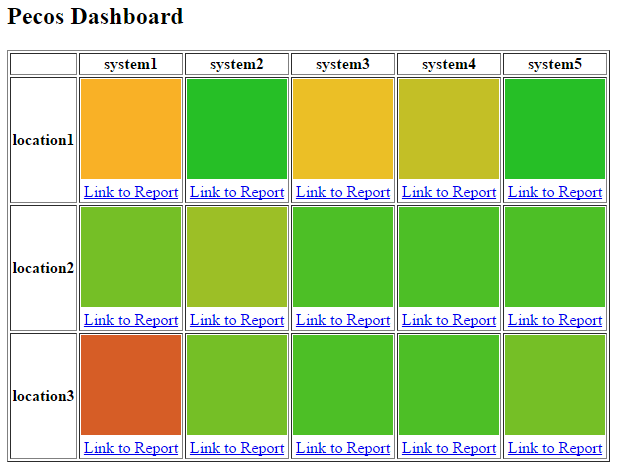
Figure 7 Example dashboard 2.
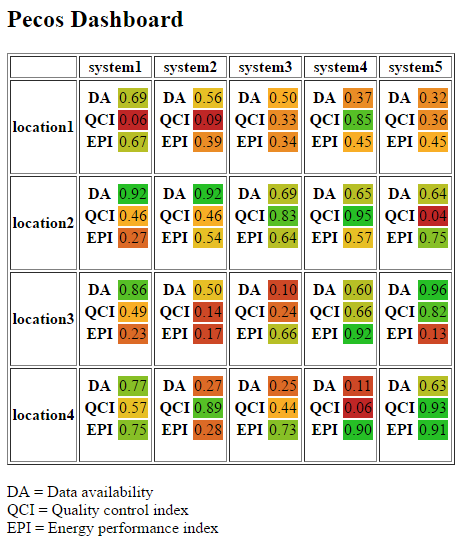
Figure 8 Example dashboard 3.
Graphics
The graphics module contains several methods to plot time series data, scatter plots, heatmaps,
and interactive graphics. These methods can be used to generate graphics that are included in
monitoring reports and dashboards, or to generate stand alone graphics. The following figures
illustrate graphics created using the methods included in Pecos.
Note that many other graphing options are available using Python graphing packages directly.
Test results graphics, generated using plot_test_results, include
time series data along with a shaded time filter and quality control test results.
The following figure shows inverter efficiency over the course of 1 day.
The gray region indicates times when sun elevation is < 20 degrees.
This region is eliminated from quality control tests. Green marks identify data points
that were flagged as changing abruptly, red marks identify data points that were outside expected range.
These graphics can be included in Monitoring reports.
Figure 9 Example test results graphic.
Day-of-year vs. time-of-day heatmaps, generated using plot_doy_heatmap,
help identify missing data, trends, define filters and define quality control test thresholds when working with large data sets.
The following figure shows irradiance over a year with the time of sunrise and sunset for each day.
The white vertical line indicates one day of missing data.
The method plot_heatmap creates a simple heatmaps.
These plots can be included as custom graphics in Monitoring reports and Dashboards.
Figure 10 Example day-of-year vs. time of day heatmap.
Interactive graphics, generated using plot_interactive_time series,
are HTML graphic files which the user can scale and hover over to visualize data.
The following figure shows an image of an interactive graphic. Many more options are available,
see https://plot.ly for more details.
Interactive graphics can be linked to Dashboards.
Figure 11 Example interactive graphic using plotly.