Simple example
A simple example is included in the examples/simple directory. This example uses data from a CSV file, simple.csv, which contains 4 columns of data (A through D).
A = elapsed time in days
B = uniform random number between 0 and 1
C = sin(10*A)
D = C+(B-0.5)/2
The data includes missing timestamps, duplicate timestamps, non-monotonic timestamps, corrupt data, data out of expected range, data that doesn’t change, and data that changes abruptly, as listed below.
Missing timestamp at 5:00
Duplicate timestamp 17:00
Non-monotonic timestamp 19:30
Column A has the same value (0.5) from 12:00 until 14:30
Column B is below the expected lower bound of 0 at 6:30 and above the expected upper bound of 1 at 15:30
Column C has corrupt data (-999) between 7:30 and 9:30
Column C does not follow the expected sine function from 13:00 until 16:15. The change is abrupt and gradually corrected.
Column D is missing data from 17:45 until 18:15
Column D is occasionally below the expected lower bound of -1 around midday (2 time steps) and above the expected upper bound of 1 in the early morning and late evening (10 time steps).
The script, simple_example.py (shown below), is used to run quality control analysis using Pecos. The script performs the following steps:
Load time series data from a CSV file
Run quality control tests
Save test results to a CSV files
Generate an HTML report
"""
In this example, simple time series data is used to demonstrate basic functions
in pecos.
* Data is loaded from a CSV file which contains four columns of values that
  are expected to follow linear, random, and sine models.
* A translation dictionary is defined to map and group the raw data into
  common names for analysis
* A time filter is established to screen out data between 3 AM and 9 PM
* The data is loaded into a pecos PerformanceMonitoring object and a series of
  quality control tests are run, including range tests and increment tests
* The results are printed to CSV and HTML reports
"""
import pandas as pd
import matplotlib.pyplot as plt
import numpy as np
import pecos

# Initialize logger
pecos.logger.initialize()

# Create a Pecos PerformanceMonitoring data object
pm = pecos.monitoring.PerformanceMonitoring()

# Populate the object with a DataFrame and translation dictionary
data_file = 'simple.csv'
df = pd.read_csv(data_file, index_col=0, parse_dates=True)
pm.add_dataframe(df)
pm.add_translation_dictionary({'Wave': ['C','D']}) # group C and D

# Check the expected frequency of the timestamp
pm.check_timestamp(900)

# Generate a time filter to exclude data points early and late in the day
clock_time = pecos.utils.datetime_to_clocktime(pm.data.index)
time_filter = pd.Series((clock_time > 3*3600) & (clock_time < 21*3600),
                        index=pm.data.index)
pm.add_time_filter(time_filter)

# Check for missing data
pm.check_missing()

# Check for corrupt data values
pm.check_corrupt([-999])

# Add a composite signal which compares measurements to a model
wave_model = np.array(np.sin(10*clock_time/86400))
wave_measurments = pm.data[pm.trans['Wave']]
wave_error = np.abs(wave_measurments.subtract(wave_model,axis=0))
wave_error.columns=['Wave Error C', 'Wave Error D']
pm.add_dataframe(wave_error)
pm.add_translation_dictionary({'Wave Error': ['Wave Error C', 'Wave Error D']})

# Check data for expected ranges
pm.check_range([0, 1], 'B')
pm.check_range([-1, 1], 'Wave')
pm.check_range([None, 0.25], 'Wave Error')

# Check for stagnant data within a 1 hour moving window
pm.check_delta([0.0001, None], 3600, 'A')
pm.check_delta([0.0001, None], 3600, 'B')
pm.check_delta([0.0001, None], 3600, 'Wave')

# Check for abrupt changes between consecutive time steps
pm.check_increment([None, 0.6], 'Wave')

# Compute the quality control index for A, B, C, and D
mask = pm.mask[['A','B','C','D']]
QCI = pecos.metrics.qci(mask, pm.tfilter)

# Generate graphics
test_results_graphics = pecos.graphics.plot_test_results(pm.data, pm.test_results, pm.tfilter)
df.plot(ylim=[-1.5,1.5], figsize=(7.0,3.5))
plt.savefig('custom.png', format='png', dpi=500)

# Write test results and report files
pecos.io.write_test_results(pm.test_results)
pecos.io.write_monitoring_report(pm.data, pm.test_results, test_results_graphics,
                                 ['custom.png'], QCI)
Results include:
HTML monitoring report, monitoring_report.html (Figure 2), includes quality control index, summary table, and graphics
Test results CSV file, test_results.csv, includes information from the summary tables
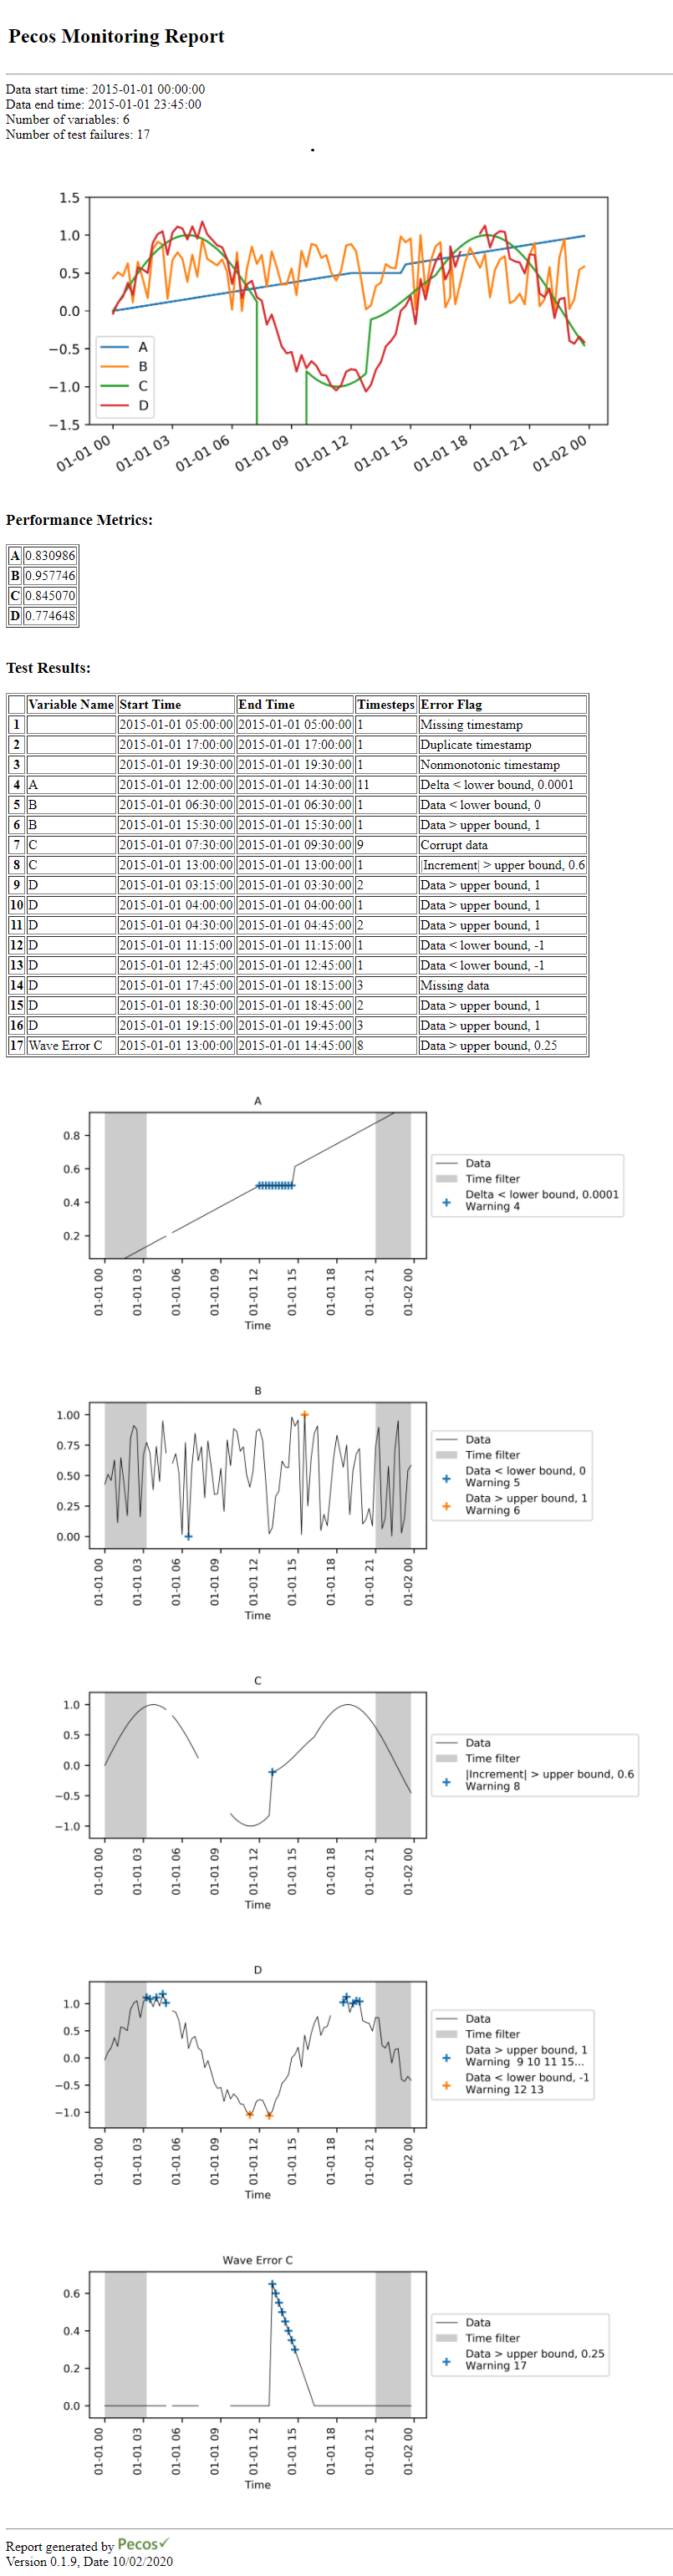
Figure 2 Example monitoring report.